CAPM and Cost of Equity: Formula and Worked Example
Key Takeaways
- Cost of equity is an opportunity cost, estimated not observed. CAPM is the market-standard estimator:
Re = Rf + Beta x ERP. - Risk-free rate: long-dated government bond, same currency as the cash flows, normalised if rates are volatile.
- Equity risk premium: 4.5%-6.0% for the US; 5.0% is a reasonable working figure. Keep it constant across scenarios and consistent with the index behind your beta.
- Beta: regress it for a public company; for a private company or division, unlever comparable betas, take the median, and relever at your target capital structure with the Hamada equation.
- Size premium: add roughly 0.8%-2.5% for mid- and small-caps (more for micro-caps); near zero for large, liquid companies. Be wary of stacking it with a large company-specific premium.
- Cost of equity vs WACC: cost of equity is equity holders' required return; WACC blends it with after-tax debt. Discount FCFE at the cost of equity, unlevered free cash flow at WACC.
- Sensitivity is mandatory. A plausible input range moves the cost of equity by 3-4 points and the valuation by 30%+. Always show a range, never a single point.
For the discount rate that sits one level up, see our guide to how to calculate WACC. To see the cost of equity inside a full valuation, work through building a DCF model in Excel or start from the DCF model template.
The cost of equity is the return shareholders demand for bearing a company's risk, and it is the hinge of almost every valuation. The market-standard way to estimate it is the Capital Asset Pricing Model (CAPM): take the risk-free rate, add beta times the equity risk premium, and - for smaller companies - a size premium on top. This guide breaks down each input, shows how to unlever and relever beta from comparable companies, works a full example end to end, and flags the mistakes that quietly distort a discount rate.
Every discounted cash flow model needs a discount rate, and every discount rate contains a cost of equity. Discount unlevered free cash flow and the cost of equity is the largest piece of WACC. Discount free cash flow to equity or dividends and the cost of equity is the discount rate. Either way, a wrong cost of equity flows straight through to a wrong valuation - and because it compounds over every forecast year and the terminal value, small errors do not stay small.
Unlike the risk-free rate or a bond coupon, the cost of equity is never quoted anywhere. It has to be estimated, and the estimator finance has settled on is CAPM. CAPM is a model, not a measurement, so the goal is a defensible number built from transparent inputs - not false precision to the basis point.
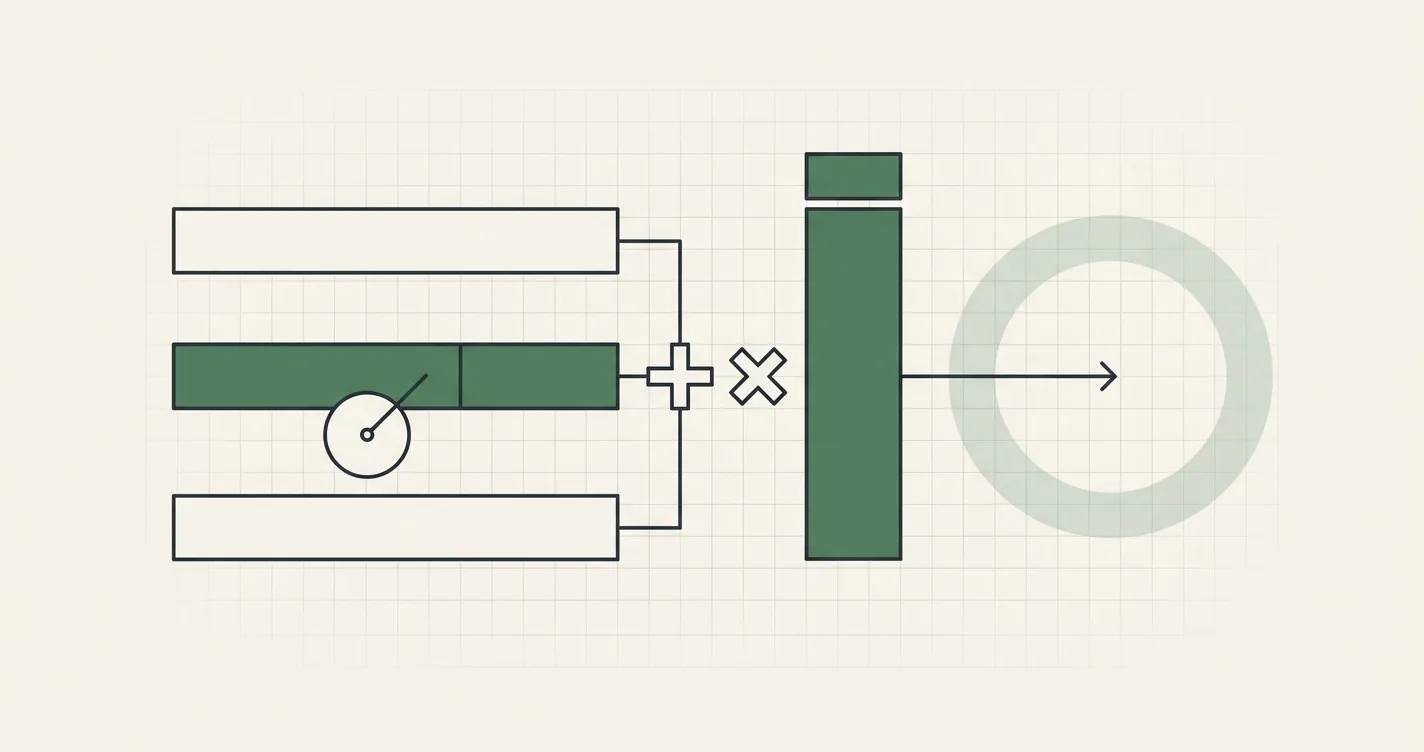
The cost-of-equity build: three market inputs (plus a size adjustment for smaller companies) feed CAPM, and the result flows into WACC and any equity-level discounting.
What the Cost of Equity Actually Means
The cost of equity is an opportunity cost. A shareholder who buys stock in Company X gives up the chance to hold something else of comparable risk. The return available on that next-best alternative is what Company X's equity must be expected to earn to justify the investment. If the company cannot clear that bar, capital should - in theory - go elsewhere.
Two consequences follow. First, the cost of equity is forward-looking: it is about expected returns, not the return the stock happened to deliver last year. Second, it is a nominal rate - it includes expected inflation - so it must be paired with nominal cash flows, not real ones.
CAPM formalises the idea with one claim: the only risk investors are compensated for is systematic risk - the part of a stock's volatility that moves with the overall market and cannot be diversified away. Company-specific (idiosyncratic) risk is assumed to be diversifiable and therefore unpriced. Whether that holds perfectly in the real world is debatable, which is why practitioners bolt on premiums for size and, sometimes, specific-company risk.
The CAPM Formula
Cost of Equity (Re) = Rf + Beta x ERP

Where:
  Rf   = Risk-free rate (yield on a long-dated government bond)
  Beta = Sensitivity of the stock's returns to the market's returns
  ERP  = Equity risk premium (expected market return minus Rf)
The term Beta x ERP is the equity risk premium for this specific company - the market-wide premium scaled up or down by how cyclical the business is. A utility with a beta of 0.6 earns a smaller premium than a semiconductor firm with a beta of 1.5, because the utility's cash flows are less tied to the economic cycle.
In Excel, once the three inputs live on an assumptions sheet:
// Cost of equity (CAPM)
= Assumptions!$B$3 + Assumptions!$B$5 * Assumptions!$B$4
//   Rf              Beta               ERP
Typical inputs at a glance (US, 2026)
| Input | Common range | Working value used here |
|---|---|---|
| Risk-free rate | 4.0%-4.8% | 4.5% |
| Equity risk premium | 4.5%-6.0% | 5.0% |
| Beta (relevered) | 0.6-1.6 | 1.24 |
| Size premium (mid-cap) | 0.8%-1.2% | 1.0% |
Input 1: The Risk-Free Rate
The risk-free rate is the return on an asset with no default risk and no reinvestment surprise over your horizon. In practice, use the current yield on a long-dated government bond in the same currency as your cash flows:
| Cash flow currency | Instrument | Illustrative yield (2026) |
|---|---|---|
| US dollar | 10-year US Treasury | 4.5% |
| Euro | 10-year German Bund | 2.6% |
| British pound | 10-year UK Gilt | 4.2% |
Yields are illustrative - always pull the live figure.
Three rules of thumb:
- Match duration to the cash flows. A DCF discounts cash flows over decades, so a 10-year (or even 20-year) bond is the right reference, not a 3-month T-bill. The T-bill is more "risk-free" in a technical sense but reintroduces reinvestment risk over a long horizon.
- Normalise if rates are whipsawing. If the 10-year yield has swung 150 bps in a year, a spot rate makes your valuation lurch for reasons unrelated to the business. Many analysts use a trailing average or a through-the-cycle estimate.
- Currency consistency. Discounting euro cash flows? Use a euro-denominated risk-free rate and a euro ERP. Mixing a US risk-free rate with euro cash flows smuggles a currency view into the valuation.
Input 2: The Equity Risk Premium
The equity risk premium (ERP) is the extra annual return investors expect for holding a diversified basket of stocks instead of the risk-free asset. It is the single most contested number in valuation, because it cannot be observed - only estimated.
Two mainstream approaches:
- Historical: the realised average premium of stocks over government bonds, measured over a long window (often 1928-present for the US). This has averaged roughly 4.5%-5.5% depending on the window and the choice of mean.
- Implied (forward-looking): back out the premium that makes today's index price equal to the present value of expected future cash flows. Damodaran publishes this monthly; it has mostly sat in a 4.5%-6.0% band over the past decade.
Arithmetic means run about 1-2 points above geometric means of the same data. Use the arithmetic mean for single-period expectations and lean toward the geometric mean over long multi-year horizons - the gap is one more reason to treat the ERP as a range, not a point.
A working assumption of 5.0% for the US is defensible and widely used. What matters most is consistency: use the same ERP across every scenario and every company in a comps-based analysis, and make sure it is measured against the same index as your beta.
Input 3: Beta
Beta measures how much a stock's returns amplify or dampen the market's returns. A beta of 1.0 means the stock has, on average, moved one-for-one with the index; 1.3 means a 10% market move has coincided with a 13% move in the stock; 0.7 means a 7% move.
Measuring beta for a public company
Regress the company's periodic returns against a broad index's returns (say, five years of monthly data):
// Raw (levered) beta from a returns regression
= SLOPE(StockReturns, MarketReturns)
Most data providers report an adjusted beta that nudges the raw figure toward 1.0 (Blume adjustment: 0.67 x raw + 0.33 x 1.0), on the empirical observation that betas mean-revert over time. Two to five years of monthly data is the usual window - weekly data adds noise, daily data adds more.
Beta for a private company or a division
There is no return history to regress, so build beta from listed comparables:
- Take the levered (equity) beta of each comparable.
- Unlever each one to strip out the effect of that comparable's specific debt load, leaving an asset (business-risk-only) beta.
- Take the median unlevered beta of the set.
- Relever it at your company's target capital structure.
The Hamada equation links the two:
Levered beta   = Unlevered beta x [1 + (1 - Tax rate) x (Debt / Equity)]
Unlevered beta = Levered beta / [1 + (1 - Tax rate) x (Debt / Equity)]
Worked comps exercise (tax rate 25% throughout):
| Comparable | Levered beta | Debt / Equity | Unlevered beta |
|---|---|---|---|
| Comp A | 1.20 | 0.30 | 0.98 |
| Comp B | 1.10 | 0.25 | 0.93 |
| Comp C | 1.35 | 0.50 | 0.98 |
| Median | - | - | 0.98 |
Check Comp A: 1.20 / (1 + 0.75 x 0.30) = 1.20 / 1.225 = 0.98. Comp B: 1.10 / 1.1875 = 0.93. Comp C: 1.35 / 1.375 = 0.98.
Relever the median at the target capital structure (target Debt / Equity = 0.35):
Relevered beta = 0.98 x [1 + (1 - 0.25) x 0.35]
              = 0.98 x [1 + 0.2625]
              = 0.98 x 1.2625
              = 1.24
// Unlever one comparable
= CompLeveredBeta / (1 + (1 - TaxRate) * CompDebtEquity)

// Relever the median unlevered beta at the target D/E
= MedianUnleveredBeta * (1 + (1 - TaxRate) * TargetDebtEquity)
The relevered beta of 1.24 is what goes into CAPM.
Worked Example: Cost of Equity for Meridian Software
Meridian Software is a mid-cap B2B SaaS business. We want its cost of equity for a DCF.
| Input | Value | Source |
|---|---|---|
| Risk-free rate (Rf) | 4.5% | 10-year US Treasury yield |
| Equity risk premium (ERP) | 5.0% | Implied US ERP, working estimate |
| Relevered beta | 1.24 | Median unlevered comp beta (0.98), relevered at target D/E of 0.35 |
Plain CAPM:
Re = Rf + Beta x ERP
   = 4.5% + 1.24 x 5.0%
   = 4.5% + 6.20%
   = 10.70%
The company-specific equity risk premium here is 1.24 x 5.0% = 6.20% - a full 1.20 points above the market's 5.0%, reflecting SaaS cyclicality and operating leverage.
Modified CAPM: Adding a Size Premium
Plain CAPM has a well-documented blind spot: over long periods, smaller companies have returned more than their betas alone predict. To close the gap, practitioners add a size premium based on the company's market capitalisation:
| Market capitalisation | Illustrative size premium |
|---|---|
| Large cap (> $10B) | 0.0% |
| Mid cap ($2B-$10B) | 0.8%-1.2% |
| Small cap ($300M-$2B) | 1.5%-2.5% |
| Micro cap (< $300M) | 3.0%-5.0% |
Ranges are illustrative and vary by data source and year.
Meridian is a mid-cap, so add a 1.0% size premium:
Re (modified) = Rf + Beta x ERP + Size premium
             = 4.5% + 6.20% + 1.0%
             = 11.70%
For a private company you might also add a company-specific premium (key-person dependence, customer concentration, a thin management team) - typically 1%-3%, and inherently judgemental. The danger is double-counting: if the comparable betas already capture the business's cyclicality and you have already added a size premium, a large extra specific-risk premium can inflate the discount rate past anything a buyer would underwrite.
// Modified / build-up CAPM
= Rf + Beta * ERP + SizePremium + CompanySpecificPremium
From Cost of Equity to WACC and DCF
The cost of equity rarely gets used on its own - it feeds WACC. Suppose Meridian's target structure is 74% equity / 26% debt (the Debt/Equity of 0.35 used to relever beta), a 6.0% pre-tax cost of debt, and a 25% tax rate:
After-tax cost of debt = 6.0% x (1 - 0.25) = 4.50%

WACC = (E/V) x Re + (D/V) x Rd x (1 - Tc)
     = 0.74 x 10.70% + 0.26 x 4.50%
     = 7.92% + 1.17%
     = 9.09%   (~9.1%)
Using the size-adjusted cost of equity (11.70%) instead:
WACC = 0.74 x 11.70% + 0.26 x 4.50%
     = 8.66% + 1.17%
     = 9.83%   (~9.8%)
That 0.7-point swing in WACC - purely from the choice to include a size premium - typically moves a DCF enterprise value by 8%-12% for a company with a mid-length growth runway. The lesson is not that one number is right; it is that the assumption must be stated openly and held constant across scenarios.
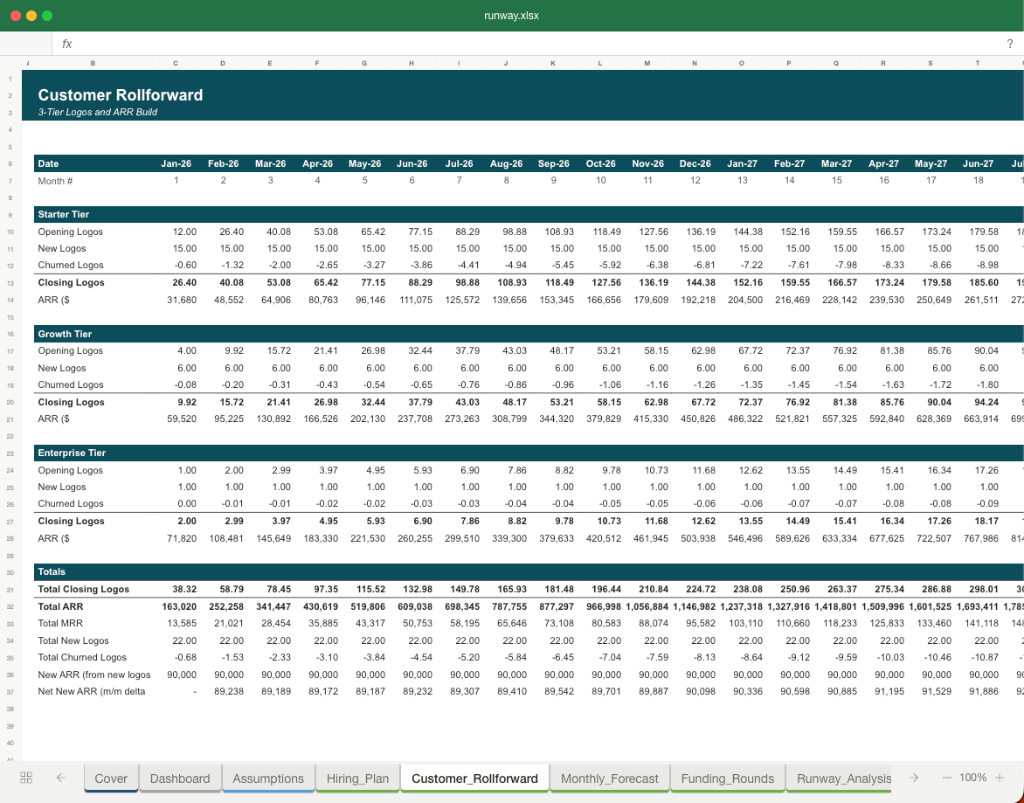
The DCF template below has the cost-of-equity build, the WACC calculation, and the sensitivity tables wired together, so you can watch the valuation respond as you change beta or the ERP:
Sensitivity: How Much Do the Inputs Matter?
Hold the risk-free rate at 4.5% and vary beta and the ERP. Each cell is the plain-CAPM cost of equity, 4.5% + Beta x ERP:
| Beta \ ERP | 4.0% | 4.5% | 5.0% | 5.5% | 6.0% |
|---|---|---|---|---|---|
| 1.00 | 8.5% | 9.0% | 9.5% | 10.0% | 10.5% |
| 1.10 | 8.9% | 9.5% | 10.0% | 10.6% | 11.1% |
| 1.20 | 9.3% | 9.9% | 10.5% | 11.1% | 11.7% |
| 1.30 | 9.7% | 10.4% | 11.0% | 11.7% | 12.3% |
| 1.40 | 10.1% | 10.8% | 11.5% | 12.2% | 12.9% |
Across this fairly conservative grid the cost of equity ranges from 8.5% to 12.9% - a 4.4-point spread, wide enough to swing a DCF valuation by well over 30%. Two takeaways:
- Beta and ERP compound each other. A high beta magnifies every tenth of a point of ERP uncertainty, so cyclical companies deserve extra care on both inputs.
- Report a range. A single cost-of-equity figure implies a precision the model does not have. Show the valuation at a low, base, and high cost of equity, just as you would for revenue growth.
(Some cells round an exact value for display - 9.45% shown as 9.5% - keep full precision in the model.)
Common Mistakes to Avoid
- Using a T-bill for the risk-free rate. A 3-month bill understates the risk-free rate for a long-horizon DCF and makes the valuation hypersensitive to the front end of the yield curve. Use a 10-year (or longer) government bond.
- Index mismatch between beta and ERP. If your beta is measured against the S&P 500, your ERP must be a US large-cap premium. Pairing an emerging-market beta with a US ERP (or vice versa) is a silent error.
- Forgetting to relever beta. Grabbing a comparable's published levered beta and dropping it straight into CAPM imports that comparable's leverage, not yours. Always unlever the set and relever at your target structure.
- Double-counting risk. A beta of 1.5, plus a 2.5% size premium, plus a 3% company-specific premium can produce a 20%+ cost of equity that no buyer would underwrite. Each add-on must cover a distinct risk not already priced.
- Letting the discount rate float with the daily 10-year. Re-pulling the spot risk-free rate every time you open the model turns valuation into a bond-market tracker. Fix a normalised rate and change it deliberately.
- Real vs nominal mismatch. CAPM produces a nominal rate. If your cash flows are in real (inflation-adjusted) terms, either restate them to nominal or strip expected inflation out of the discount rate - do not mix.
- Treating CAPM output as exact. The inputs each carry error bars of half a point or more. Present the cost of equity as a range and run the valuation across it.

Alex Tapio
Founder of Finamodel • Professional Financial Modeller • Ex-Deloitte