 Onfleet Financial Model
Logistics/Mobility Startup Financials (Free Excel Download)
SaaS platform ("operating system") for last-mile delivery management - routing, dispatch, driver apps, customer tracking.



professionals from Deloitte
Used by professionals from






About this model
Onfleet is SaaS for last-mile delivery routing, dispatch, driver apps, and customer tracking. It serves businesses that need an operating system for local delivery fleets.
The model should start with customers and their drivers or deliveries, then apply subscription ARPU and usage to build revenue. This separates the installed customer base from delivery activity.
Forecast expansion, churn, and support cost as customer fleets scale. The result should show how local-delivery operations drive recurring software revenue and the cost to support that growth. Keep routing, dispatch, driver apps, and customer tracking connected to the same local-fleet operating system for every business.
A turnkey financial model
Live formulas, no hardcoded values
Outputs are driven by live formulas, so the workbook updates from its assumptions instead of relying on hardcoded results.
All assumptions in one tab
Inputs are clearly marked in the Assumptions tab and separated from calculations, making it clear what to change and what to leave intact.
Statements always balancing
For integrated-statement models, the balance sheet, cash flow, and supporting schedules tie through properly.
Distinct schedules for clarity
Debt, working capital, taxes, and cash flow can get messy quickly. We group calculations in clear schedules, not across disconnected tabs.
No hidden macros or external links
There are no unexplained external workbook links or macros to undermine auditability or portability.
Changes flow through the model
Update a key driver and see the impact carry through the forecast, financing, and return outputs. We never use hardcoded numbers in formulas.
About Onfleet
onfleet.com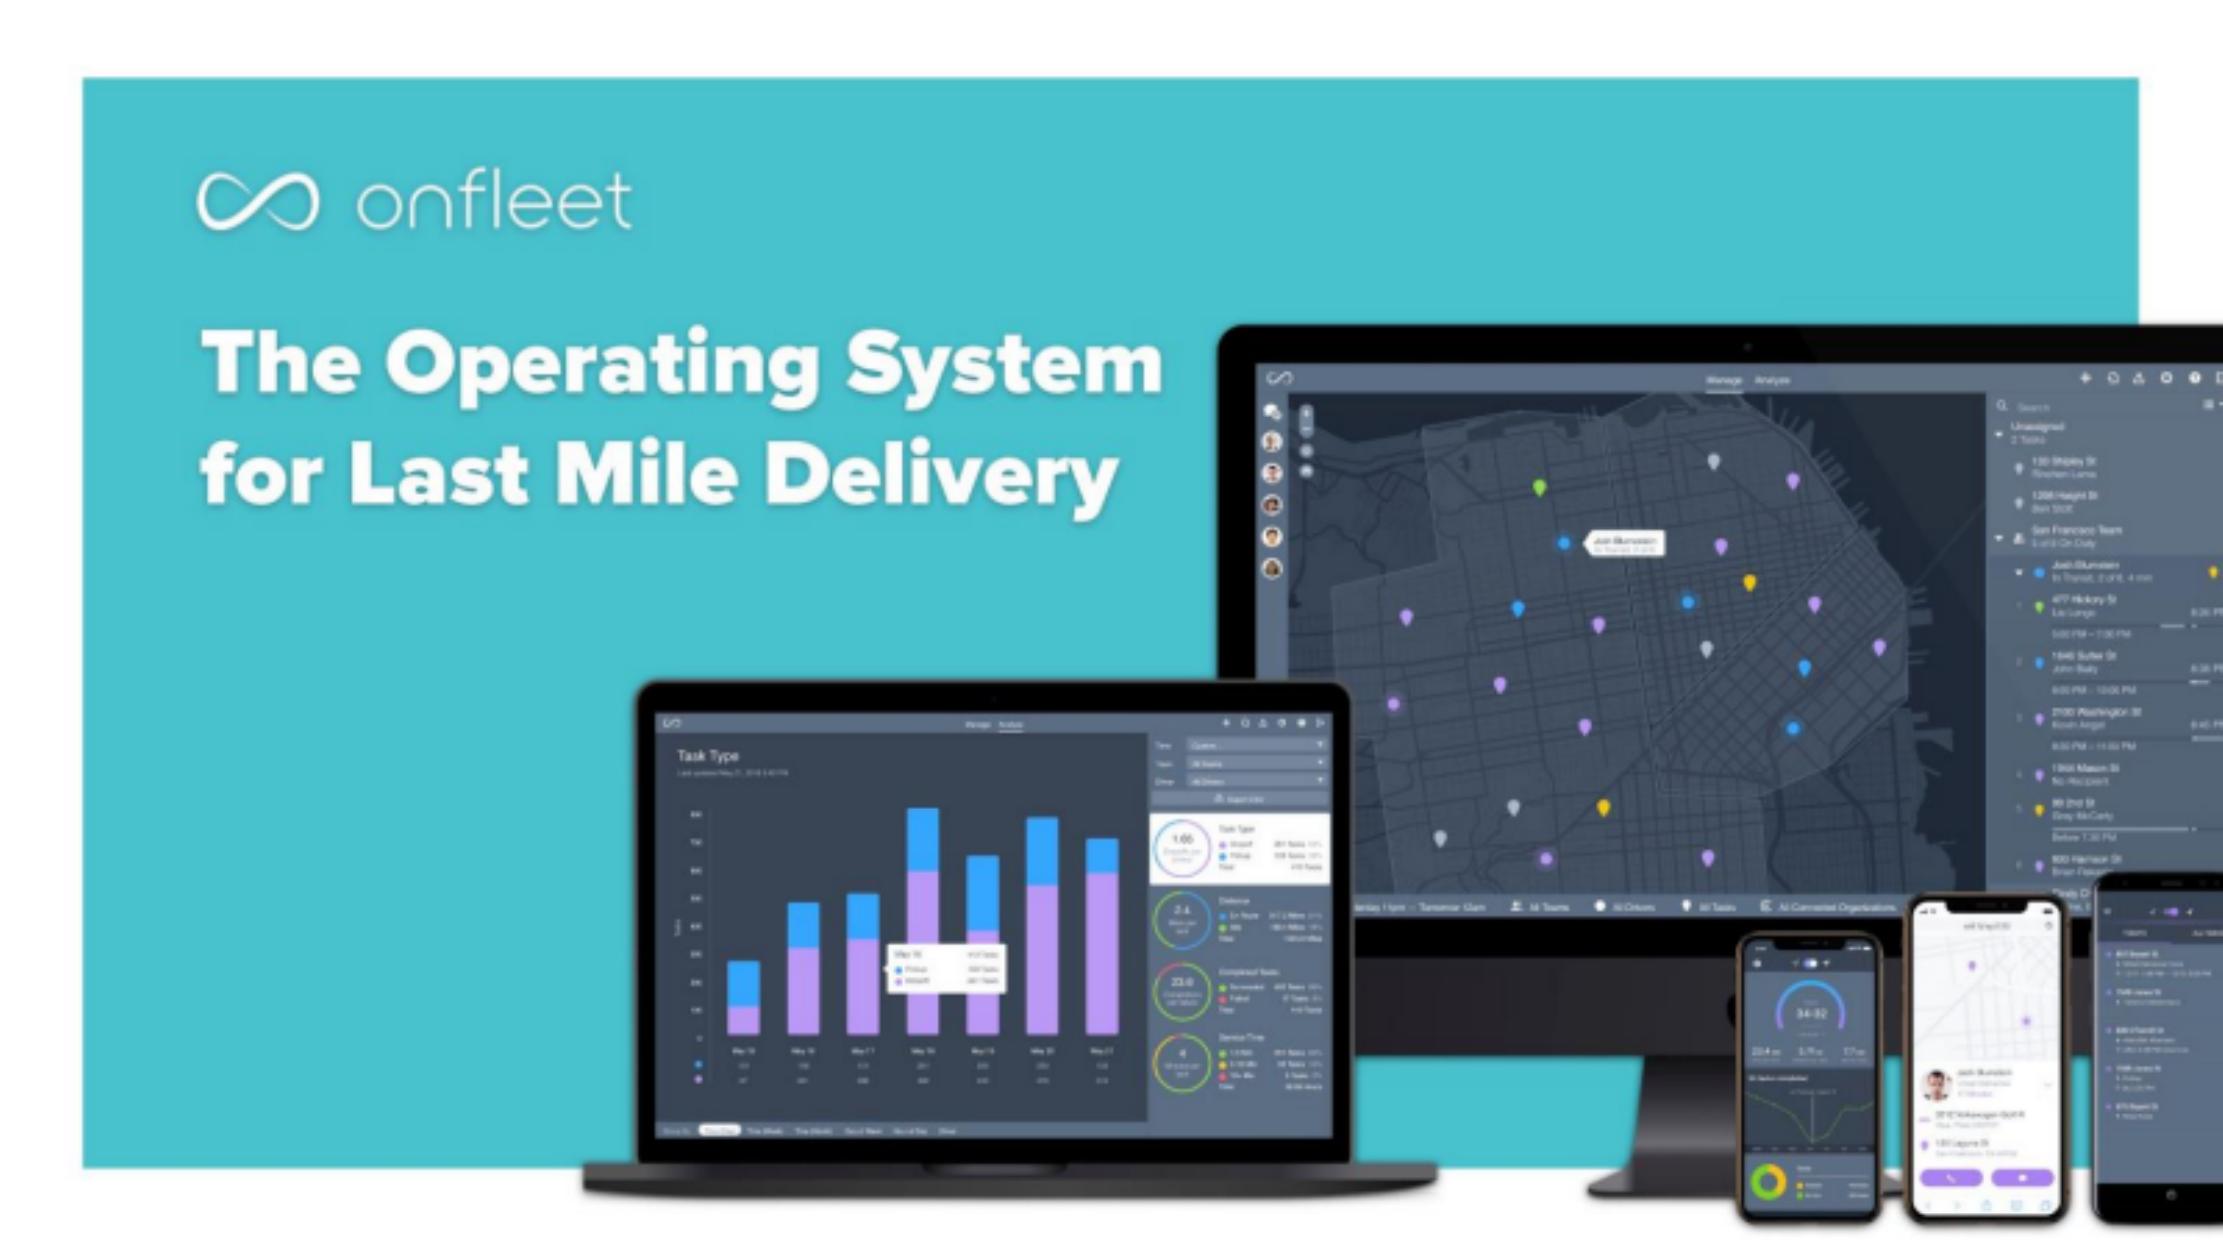
How to build a detailed financial model for Onfleet
A complete walkthrough of the business, drivers, and assumptions behind the downloadable Onfleet model - distilled from its pitch deck and publicly available information.
Product & value proposition
- Web dashboard: real-time dispatch, route planning & optimization, delivery analytics.
- Driver mobile app (iOS/Android): offline/online tracking, in-app comms, proof of delivery, barcode scanning, age verification.
- Customer-facing tracking page: live driver location, ETA, feedback collection.
- Proprietary ML: 250m+ miles of location data trains ETA and route-optimization models.
- Positioned against manual dispatch and legacy incumbents (Descartes, WorkWave, Route Manager, CXT).
Market
- U.S.: 30 million daily local deliveries; 30% are local/non-carrier = 9.79m deliveries/day addressable.
- U.S. SAM: $1.6B annually (current product scope).
- Global TAM: 90m deliveries/day = $7.2B.
- Market CAGR: 9.3%.
- COVID-19 cited as structural accelerant for retail-to-delivery transition.
- Consumer stat: 84% of consumers won't return after one poor delivery experience; 89% define "fast" as same-day.
Revenue model
Four subscription tiers, billed monthly, with per-task overage:
| Tier | Monthly price | Included tasks | Overage per task |
|---|---|---|---|
| Starter | $149 | 1,000 | $0.13 |
| Basic | $349 | 2,500 | $0.16 |
| Premium | $799 | 5,000 | $0.18 |
| Professional | $1,999 | 12,500 | $0.18 |
- Higher tiers unlock: full API, route optimization, chat, predictive ETA, ETA notifications, barcode scanning, age verification, dedicated phone number, white-label.
- Revenue mix by vertical: shown in Appendix B but values redacted. Shape of bar chart suggests top 1–2 segments ~35% and ~21% of revenue; long tail of smaller verticals.
- MRR per logo trending upward Q1 2018 → Apr 2020 (values redacted).
Traction & metrics
- 3 million deliveries/month as of ~Apr 2020; volume spiked sharply with COVID-19 (line chart shows near-vertical inflection early 2020).
- 50m+ total deliveries powered (cumulative).
- 200m+ miles tracked.
- 1,000+ cities, 90+ countries.
- 800 retailers & delivery businesses (logo count).
- Revenue "Doubling YoY" (headline only; financials chart redacted).
- Profitable on $5m raised to date.
- Notable customers: GAP, Kroger, United Supermarkets, Imperfect Foods, Raley's, Sweetgreen, Thistle, UrbanStems, Hungry Harvest, Firehouse Subs, GrubMarket, MedMen, Drizly, Alto, Lugg.
- Award recognition: Capterra Best Value & Best Ease of Use 2020; Software Advice Most Recommended & Best Customer Support 2020; GetApp Best Functionality & Features 2020.
- Customer testimonial: 50% delivery capacity increase via route optimization (The United Family).
Unit economics
- Implied revenue per task from pricing table: $0.13–$0.18 overage; base plan effective rate ranges from $0.149/task (Starter) to $0.16/task (Professional at cap).
- MRR per logo growing consistently Q1 2018 → Apr 2020 - trend visible, absolute values redacted.
- Company is profitable, implying positive unit economics at current scale, but no margin data disclosed.
Competition / moat
- Competitive framing: market is fragmented with manual dispatch or legacy incumbents (Descartes, WorkWave, Route Manager, CXT) - positioned as modern, easy-to-use alternative.
- Moat claims:
- 250m+ miles proprietary location data training ML for ETA & optimization.
- Network effect of scale (more deliveries → better models).
- High switching cost: embedded in customer dispatch operations.
- Brand / awards (customer satisfaction scores).
- No direct SaaS peer comparison matrix shown.
Team & funding ask / use of funds
- Founding team:
- Khaled Naim - Co-Founder & CEO (Stanford GSB, University of Michigan).
- David Vetrano - Co-Founder & CTO (Stanford Engineering, CS; Carnegie Mellon).
- Mikel Cármenes-Cavia - Co-Founder & VP Engineering (University of New Brunswick; IBM).
- Total raised to date: $5m.
- Investors: Playfair Capital, CrunchFund, StartX (Stanford), Winklevoss Capital, SGH Capital.
- Angels: Andy Rachleff, Lee Linden, Jude Gomila, Gil Penchina, Tom Fallows.
Recommended financial model
Archetype + why: SaaS subscription + usage (task-based) revenue model. Core MRR comes from tiered subscriptions; a material variable component comes from task overages. This is a classic "seat + consumption" hybrid SaaS - model both components separately. Given the company is already profitable and growing revenue 2x YoY, the model should focus on revenue scaling and margin expansion, not burn/runway.
Forecast horizon & granularity: Monthly for Year 1–2, quarterly for Years 3–5. Five-year model is appropriate given growth stage and investor audience.
Key drivers & assumptions:
| Driver | Seed value |
|---|---|
| Active logos (customers) at model start | 800 |
| Monthly deliveries at model start | 3,000,000 |
| Revenue growth rate (YoY) | ~100% (stated "doubling") |
| Blended effective price per task | ~$0.15–$0.18 |
| Tasks per customer per month | 3,000,000 / 800 = ~3,750 avg |
| % of tasks generating overage revenue | 20–30% of volume above plan cap |
| Net revenue retention (NRR) | 110–120% - consistent with MRR/logo growth trend and usage expansion |
| Gross churn (logo) | 8–12% annual - B2B SaaS logistics median |
| New logo additions per month | 30–50/month at model start, growing with marketing investment |
| Gross margin | 65–75% - cloud-hosted SaaS with modest COGS (hosting, support, ML infra) |
| S&M as % of revenue | 20–30% - primarily inbound/PLG given awards traction |
| R&D as % of revenue | 20–25% - ML/product investment |
| G&A as % of revenue | 8–12% |
| Operating profit margin at model start | Profitable but thin (implied) |
| Market CAGR (macro tailwind) | 9.3% |
| U.S. SAM | $1.6B |
| Global TAM | $7.2B |
Scenarios (Base / Bull / Bear - which variables flex):
- Base: ~100% revenue YoY growth (consistent with stated trajectory); logo additions 40/month; NRR 115%; gross margin 70%.
- Bull: COVID demand sustains; logo growth accelerates to 70+/month; NRR 125% as existing customers scale task volumes; potential enterprise/Professional tier upsell lifts ARPU.
- Bear: Post-COVID normalization slows delivery volumes; logo growth 20/month; NRR 105%; pricing pressure from incumbents responding; gross margin compresses to 60% with ML infra costs.
Required sheets / outputs:
- Assumptions - all drivers in one tab, clearly tagged vs.
- Logo & MRR Build - monthly cohort waterfall: beginning logos, new adds, churned, ending; base MRR + overage MRR by tier.
- Revenue Bridge - subscription MRR vs. task overage revenue; total ARR.
- P&L (Income Statement) - revenue, COGS, gross profit, S&M, R&D, G&A, EBITDA, net income.
- Key SaaS Metrics - ARR, MRR, ARPU, NRR, gross churn, LTV/CAC (modeled), Rule of 40.
- Market Penetration - logos vs. SAM/TAM implied % capture over time.
- Scenarios - Base/Bull/Bear toggle on revenue growth, logo adds, NRR.
- Dashboard - ARR, EBITDA margin, NRR, logo count, monthly deliveries - summary view.
Frequently asked
Is the Onfleet financial model free?+
Yes. The Onfleet model is a free Excel (.xlsx) download with live formulas. Sign up with your email and the workbook is yours to keep, review, and edit.
What's included in the model?+
A 5-year monthly forecast with P&L, cash flow and runway, valuation (exit multiple plus a DCF cross-check), MOIC/IRR returns, and unit economics, with live formulas throughout.
How was this model built?+
It was built from Onfleet's pitch deck and publicly available information, then structured to investment-banking standards as a fully editable Excel model.
Can I change the assumptions?+
Yes. You can change assumptions and the live formulas will recalculate in the downloadable Excel model.
Have more financial modelling questions? Contact us

Created by ex-finance professionals
Hey, I’m Alex and I created Finamodel.
Over my years in the finance industry I kept building the same models over and over again. Same structure, same assumptions, different logo. So I started building frameworks to turn them into clean, reusable templates.
Every model here is one I’d actually use for a client, and I personally vet each one before it goes up.
I’m not an expert in every industry, but I’ve built enough models to know what belongs in one. And when something is completely foreign to me, I reach out to my network for experts to work on our models with us.
Having a template library on hand cuts a first build from hours to minutes.
Need help finding your model? You’ll find me in the Finamodel app!
Other Logistics/Mobility Startup Financial Models
Browse another startup in the same category.

BusRight
SaaS platform for K-12 school district transportation management - routing, real-time tracking, driver tablets, parent notifications.
Clean Kitchen Club
UK plant-based QSR brand operating eat-in, grab-and-go, and delivery formats across London, with plans for nationwide expansion.

Cloudsmith
Cloud-native software supply chain management platform - secure, managed package distribution for engineering teams.
Enron
Enron Communications ("ePower") is a wholly owned subsidiary of Enron Corp. pitching an application delivery platform built on a national Pure IP fiber optic network.
Hangry
Indonesia's first multi-brand virtual restaurant operator ("House of Winning Brands") running delivery-only F&B brands out of shared kitchen infrastructure.

Hologram
IoT cellular connectivity platform that abstracts SIM management, carrier selection, and device fleet operations into a single software layer.

HTEC
Technology services and product engineering firm providing outsourced R&D, product development, and engineering delivery to corporates, scaleups, and global enterprises.
Liefergrün
Sustainable, customer-oriented last-mile delivery solution for e-commerce, using cargo bikes and e-vans with microhub infrastructure.


