HAHangry Financial Model
Logistics/Mobility Startup Financials (Free Excel Download)
Indonesia's first multi-brand virtual restaurant operator ("House of Winning Brands") running delivery-only F&B brands out of shared kitchen infrastructure.



professionals from Deloitte
Used by professionals from






About this model
Hangry is an Indonesian multi-brand virtual-restaurant operator running delivery-only brands from shared kitchens. Its House of Winning Brands approach uses centralised infrastructure to launch and optimise multiple food concepts.
The model should build from kitchens and active brands into orders and average ticket. Shared-kitchen economics should capture how several concepts use the same operating base.
Forecast food cost, delivery commissions, labour, and contribution margin by kitchen or brand. This shows whether higher order density and brand expansion improve the economics of the delivery-only model. Keep each food concept visible so optimisation of the House of Winning Brands can be evaluated.
A turnkey financial model
Live formulas, no hardcoded values
Outputs are driven by live formulas, so the workbook updates from its assumptions instead of relying on hardcoded results.
All assumptions in one tab
Inputs are clearly marked in the Assumptions tab and separated from calculations, making it clear what to change and what to leave intact.
Statements always balancing
For integrated-statement models, the balance sheet, cash flow, and supporting schedules tie through properly.
Distinct schedules for clarity
Debt, working capital, taxes, and cash flow can get messy quickly. We group calculations in clear schedules, not across disconnected tabs.
No hidden macros or external links
There are no unexplained external workbook links or macros to undermine auditability or portability.
Changes flow through the model
Update a key driver and see the impact carry through the forecast, financing, and return outputs. We never use hardcoded numbers in formulas.
About Hangry
hangry.ai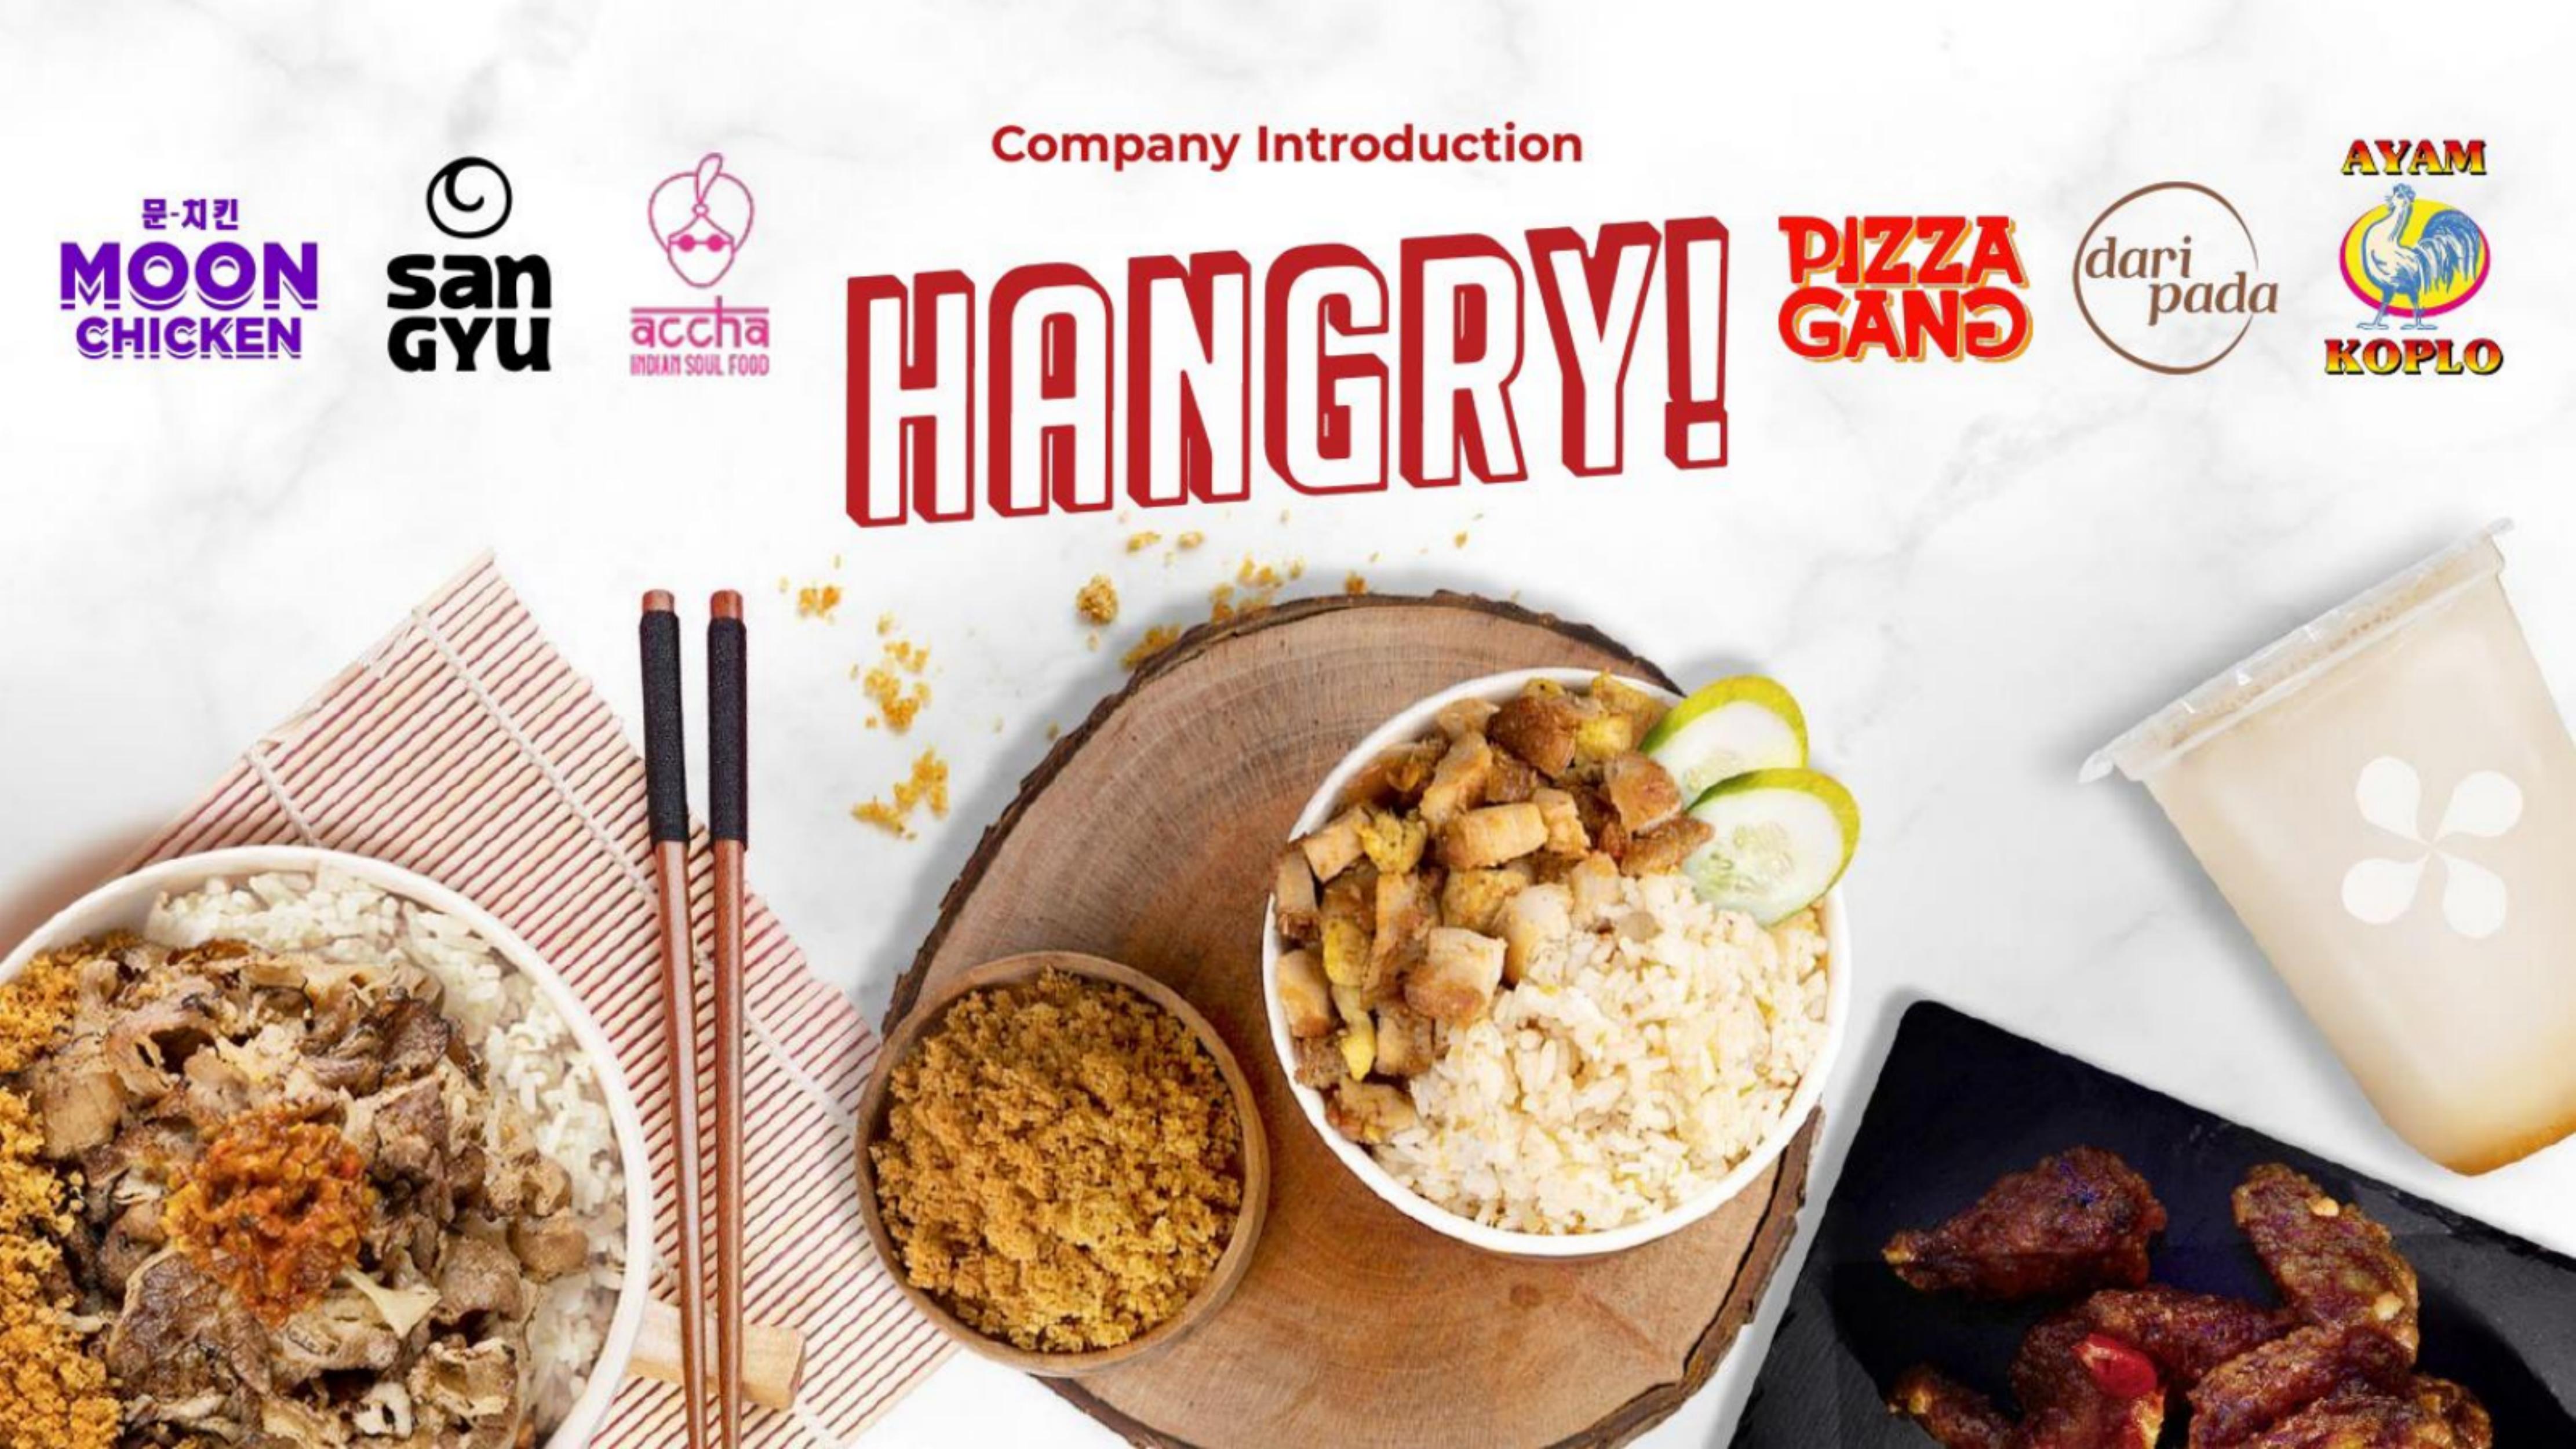
How to build a detailed financial model for Hangry
A complete walkthrough of the business, drivers, and assumptions behind the downloadable Hangry model - distilled from its pitch deck and publicly available information.
Product & value proposition
- Portfolio of 6 owned F&B brands (as of deck date, ~Mar 2022):
- Ayam Koplo (Indonesian fried chicken rice)
- San Gyu (Japanese-inspired beef bowl; 92% recommendation rate, NPS 52)
- Dari Pada (Indonesian comfort food)
- Moon Chicken (Korean fried chicken; NPS 60)
- Accha Indian Soul Food (Indian cuisine localised for Indonesian palate; NPS 48, acquired)
- Pizza Gang (soft-launched Feb 2022)
- Multi-channel distribution: GrabFood, GoFood, Hangry app (H!), ShopeeFood, Traveloka Eats, dine-in.
- Capital-light expansion model: mix of company-operated outlets, partner-funded outlets, and equity crowdfunding (LandX, CrowdDana platforms).
- Vision: "Becoming a part of global citizens' daily lives".
Market
- Indonesia F&B total revenue: $23B (2021) → $41B (2025F) at ~16% p.a. - source: Momentum Works, Bain, Euromonitor.
- Indonesia F&B Delivery GMV: $4.6B (2021) → $9.3B (2025F) at ~19% p.a..
- No SAM or SOM figures stated in deck. No cloud kitchen-specific share numbers given.
- Competitive context: global cloud kitchen players cited (SmartCity Kitchens $15bn, Kitopi >$1bn, Rebel Foods $1.7bn, Reef Kitchens >$1bn) but "no dominant player in SEA yet".
Revenue model
- Primary: food product sales via third-party delivery aggregators; Hangry earns net revenue after aggregator commissions.
- Secondary channels: dine-in at flagship stores (e.g. Moon Chicken Station Senopati); Hangry-owned app (H!).
- Expansion funding: franchisee-like partnership scheme (individuals fund entire outlet) and equity crowdfunding (retail investors from ~$100) - Hangry retains full operations.
- No ASP (average selling price), order volumes, GMV, or net revenue figures disclosed in deck.
Traction & metrics
- Outlets: 1 outlet (Nov 2019 launch) → 84 outlets (Apr 2022) → 132 outlets projected by end-2022.
- Time elapsed: ~30 months to 84 outlets.
- Cities: Jakarta → Bandung (Dec 2020) → Surabaya + Semarang (Dec 2021–Jan 2022) → Medan + Makassar (Mar 2022).
- Brand NPS:
- San Gyu: NPS 52, 92% recommendation rate (survey n>150)
- Moon Chicken: NPS 60
- Accha: NPS 48
- No revenue, GMV, order count, AOV, or retention figures disclosed.
Competition / moat
- Claimed "first multi-brand virtual restaurant and House of Winning Brands in Indonesia".
- No domestic direct comp named; indirect infrastructure enablers are Shopee/GoTo/Grab/Traveloka.
- Global cloud kitchen comps cited as evidence of category size, not as direct threats.
- Moat sources implied: brand portfolio breadth, multi-channel reach, VC-backed network, experienced founding team with prior exits.
Team & funding ask / use of funds
Team (all from slide 13):
- Abraham Viktor, CEO - serial entrepreneur, founder of Taralite (acq. OVO); food influencer (@hungrybram, Asia 50 Best voter).
- Andreas Resha, President - former VP Cermati (acq. Djarum), CFO Jurnal (acq. Sleekr).
- Robin Tan, CTO/CMO - former CTO Taralite (acq. OVO), Product Lead OVO; NTU LKY Gold Medal.
- Arlene Sutjiamidjaja, CBO - ex-Shopee Indonesia (early BD team, Seller Management head).
- Sari Dewi Lauda, COO - serial F&B entrepreneur; co-owner of 40+ outlet restaurant groups, 10+ years F&B ops.
- Wenyou Tan, CFO - former OVO exec team (fundraising + M&A), COO Taralite, SBI Investments.
Funding history:
- Jan 2020: US$3mn Seed (Sequoia Surge)
- Apr 2021: US$13mn Series A (Alpha JWC)
- Mar 2022: US$22mn Series A2 (JCP / Journey Capital Partners)
- Total raised: ~US$38mn
Use of funds / ask: Not explicitly stated in deck. Implied: national expansion (132 outlets by end-2022), new brand launches, and potential further acquisitions.
Recommended financial model
Archetype + why: Multi-brand cloud kitchen / virtual restaurant outlet roll-up P&L. Similar to a restaurant chain roll-up model but with delivery-first economics (aggregator commissions, no FOH labour). Closest archetype: unit-economics-driven outlet expansion model with brand-level P&L aggregation. NOT a SaaS or marketplace model.
Forecast horizon & granularity:
- Monthly for Year 1 (2022), quarterly for Years 2–4 (2023–2025).
- Outlet-level unit economics flow up to brand-level, then company consolidated P&L.
- Match to market forecast horizon of 2025F.
Key drivers & assumptions:
*Outlet roll-out:*
- Outlets at Apr-22: 84
- Outlets target end-2022: 132 - implies ~48 net new opens in ~8 months
- Outlet opening rate post-2022: 60–80 per year, decelerating as cities saturate; rationalize against funding runway
- Outlet closure / churn rate: 5% p.a.; cloud kitchen outlets have lower fixed costs but also lower switching costs
*Revenue per outlet:*
- Average Monthly Revenue per Outlet (AMRO): IDR 60–100mn (~$4–7k USD/month); no figure in deck. Benchmarked against Indonesian F&B delivery norms.
- Aggregator commission take rate: 25–30% of GMV (standard GrabFood/GoFood rate in Indonesia)
- Hangry net revenue = GMV × (1 – commission rate)
- Blended ASP per order: IDR 50–70k (~$3.5–5 USD); Indonesian fast-casual delivery price point
- Orders per outlet per day: 30–60 based on single kitchen serving multiple brands simultaneously
*Outlet economics (per outlet per month):*
- Food COGS: 35–40% of net revenue (typical Indonesian F&B; no deck data)
- Kitchen labour: 15–20% of net revenue
- Outlet rent / kitchen fee: IDR 10–20mn/month depending on city tier
- Partner/crowdfunding-funded outlet capex split: assume 30–40% of new outlets are partner-funded (lower cash capex for Hangry)
- Outlet-level EBITDA margin: 10–20% after above; target breakeven within 6–12 months per outlet
*Corporate overhead:*
- HQ costs (tech, brand management, central ops): scale at ~15% of net revenue
- Marketing / brand building: 5–10% of net revenue; aggregator in-app promotions
- Acquisitions (e.g. Accha model): treat as one-off capex items with step-up in brand revenue
*Funding:*
- US$22mn Series A2 (Mar 2022) is the base liquidity assumption
- Runway model: test against monthly cash burn to determine Series B timing
Scenarios (Base / Bull / Bear - variables that flex):
- Base: 132 outlets end-2022 as stated; AMRO IDR 75mn; food COGS 38%; partner-funded share 35%
- Bull: 150 outlets end-2022; AMRO IDR 90mn (higher order density in new cities); faster Accha/Pizza Gang ramp
- Bear: 110 outlets end-2022 (execution delays); AMRO IDR 60mn; aggregator commissions rise to 32%; single-city concentration risk
Required sheets / outputs:
- Assumptions - all drivers consolidated, colour-coded inputs
- Outlet Roll-out - monthly new opens, closures, total active by city and brand
- Revenue Build - GMV → net revenue per outlet cohort × brand
- Unit Economics - per-outlet P&L (food COGS, labour, rent, contribution margin)
- Consolidated P&L - brand-level → company; EBITDA bridge
- Cash Flow & Runway - capex per outlet, partner/crowdfund offset, operating cash flow, Series B timing
- Funding Sources - history + implied use of A2 proceeds
- Sensitivity - AMRO × outlet count × food COGS margin matrix
- Dashboard - KPI summary (outlets, net revenue, EBITDA margin, cash runway)
Frequently asked
Is the Hangry financial model free?+
Yes. The Hangry model is a free Excel (.xlsx) download with live formulas. Sign up with your email and the workbook is yours to keep, review, and edit.
What's included in the model?+
A 5-year monthly forecast with P&L, cash flow and runway, valuation (exit multiple plus a DCF cross-check), MOIC/IRR returns, and unit economics, with live formulas throughout.
How was this model built?+
It was built from Hangry's pitch deck and publicly available information, then structured to investment-banking standards as a fully editable Excel model.
Can I change the assumptions?+
Yes. You can change assumptions and the live formulas will recalculate in the downloadable Excel model.
Have more financial modelling questions? Contact us

Created by ex-finance professionals
Hey, I’m Alex and I created Finamodel.
Over my years in the finance industry I kept building the same models over and over again. Same structure, same assumptions, different logo. So I started building frameworks to turn them into clean, reusable templates.
Every model here is one I’d actually use for a client, and I personally vet each one before it goes up.
I’m not an expert in every industry, but I’ve built enough models to know what belongs in one. And when something is completely foreign to me, I reach out to my network for experts to work on our models with us.
Having a template library on hand cuts a first build from hours to minutes.
Need help finding your model? You’ll find me in the Finamodel app!
Other Logistics/Mobility Startup Financial Models
Browse another startup in the same category.

BusRight
SaaS platform for K-12 school district transportation management - routing, real-time tracking, driver tablets, parent notifications.
Clean Kitchen Club
UK plant-based QSR brand operating eat-in, grab-and-go, and delivery formats across London, with plans for nationwide expansion.

Cloudsmith
Cloud-native software supply chain management platform - secure, managed package distribution for engineering teams.
Enron
Enron Communications ("ePower") is a wholly owned subsidiary of Enron Corp. pitching an application delivery platform built on a national Pure IP fiber optic network.

Hologram
IoT cellular connectivity platform that abstracts SIM management, carrier selection, and device fleet operations into a single software layer.

HTEC
Technology services and product engineering firm providing outsourced R&D, product development, and engineering delivery to corporates, scaleups, and global enterprises.
Liefergrün
Sustainable, customer-oriented last-mile delivery solution for e-commerce, using cargo bikes and e-vans with microhub infrastructure.
Little Spoon
Direct-to-consumer fresh organic baby and kids' food subscription, expanding into vitamins/supplements and a parenting content platform.


